
Let’s be real — most of us don’t think about bandwidth until something goes wrong.
Maybe your Netflix keeps buffering mid-episode. Your Zoom call freezes right when you’re making your most important point. Or your ISP just hit you with a surprise overage charge that made your jaw drop.
At that moment, you wish you’d been paying attention to your bandwidth usage all along.
The good news? Checking your data consumption is way easier than you think. Whether you’re on Windows, Mac, a smartphone, or want to monitor your entire home network through your router — this guide covers every method, every tool, and every trick you need to know.
1. What Is Bandwidth Usage (and Why Should You Care)?
Before we jump into the how-to, let’s make sure we’re speaking the same language.
Bandwidth refers to the maximum rate at which data can be transmitted over an internet connection — think of it like a water pipe. The wider the pipe, the more data flows through per second.
Bandwidth usage (also called data consumption or internet usage) is how much of that pipe you’re actually using over time. Every YouTube video you stream, every file you download, every cloud backup quietly running in the background — all of it counts toward your total.
💡 Quick Terminology Check: Bandwidth = your connection speed (Mbps). Data usage = total volume consumed (GB/TB). A fast connection doesn’t mean you’re not using a lot of data — it just means you can chew through it faster.
Why Monitoring Your Internet Bandwidth Actually Matters
Here’s why keeping a close eye on your network traffic usage is one of the smartest habits you can build:
- Avoid ISP overage fees — Many internet plans cap monthly data. Exceed it and you’re paying extra, sometimes a lot extra.
- Diagnose slow internet — Bandwidth monitoring reveals if a specific app, device, or user is saturating your connection.
- Spot unauthorized access — Unusual spikes in data transfer can signal a freeloading neighbor or worse — malware phoning home.
- Optimize your plan — You may be overpaying for speed you don’t need, or suffering throttling because you’re constantly underpaying.
- Plan upgrades intelligently — Real usage data helps you decide whether to upgrade your plan, your router, or both.
📊 Did You Know? The average US household now consumes over 400 GB of data per month — and most people have no idea. 4K streaming alone burns through roughly 7 GB per hour.
2. How to Check Bandwidth Usage on Windows
Windows gives you multiple built-in ways to check your data usage per app and monitor real-time network activity — no third-party software required.
Method A: Windows Settings (Quickest Method)
This is the fastest way to get a 30-day overview of your data consumption.
Step 1: Press Windows + I to open Settings. Navigate to Network & Internet.
Step 2: Click on Data usage in the left sidebar. You’ll instantly see a summary of how much data each app has consumed over the past 30 days.
Step 3: Scroll down to see a per-app breakdown. Look for surprise data hogs — cloud backup apps and Windows Update are the most common culprits.
Step 4 (Optional): Click on your network adapter and set a monthly data limit to get warnings before you blow past your ISP cap.
Method B: Task Manager — Real-Time Bandwidth Monitoring
Want to catch which app is hammering your connection right now?
- Press Ctrl + Shift + Esc to open Task Manager
- Click the Performance tab
- Select Open Resource Monitor at the bottom
- Under the Network tab, you’ll see live bandwidth usage per process
This is invaluable for catching runaway apps eating your upload or download capacity in real time.
Method C: Command Prompt for Network Statistics
Power users love this one. Open Command Prompt and run:
netstat -eThis displays cumulative bytes sent and received since your last reboot. For more detailed interface stats, try netstat -s. Not the prettiest visualization, but it’s fast and always available — no GUI required.
⚠️ Pro Tip: Windows resets its 30-day usage counter on a rolling basis, not on your billing cycle. If your ISP resets on the 15th, manually note your usage on that date each month for accurate tracking.
3. How to Check Bandwidth Usage on Mac
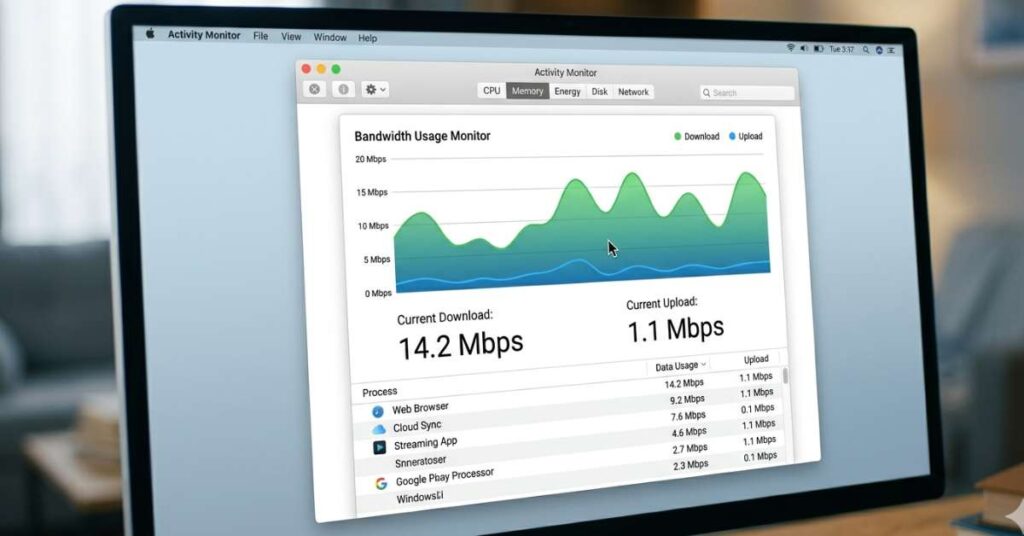
macOS handles network bandwidth monitoring a little differently — it doesn’t have a built-in per-app 30-day data tracker like Windows does. But Activity Monitor more than compensates when you need to troubleshoot in real time.
Using Activity Monitor for Live Network Usage
Step 1: Press Command + Space, type “Activity Monitor,” and hit Enter. Or find it in Finder under Applications → Utilities.
Step 2: Click the Network tab. You’ll see a live list of every process currently sending or receiving data, along with bytes in and bytes out per second.
Step 3: Click the Bytes Rcvd column header to sort from highest to lowest. Any bandwidth hogs will immediately float to the top of the list.
Using the Terminal for Network Statistics
Open Terminal and run:
nettopThis gives you a live, updating view of network traffic per process — including total bytes sent and received since each process launched. Press q to quit.
For cumulative interface statistics, use:
netstat -ib💬 “Understanding your bandwidth usage is like reading your electricity meter — most people don’t bother until the bill arrives.”
4. How to Monitor Bandwidth Usage on Your Router
Here’s the thing about monitoring individual devices: it only gives you half the picture.
If you want to see total network bandwidth usage across every connected device — laptops, phones, smart TVs, gaming consoles, IoT gadgets — your router is the best vantage point. Everything on your network funnels through it.
Step 1: Access Your Router’s Admin Panel
Open a browser and type your router’s default IP address — usually 192.168.1.1 or 192.168.0.1.
Not sure which one?
- On Windows: Run
ipconfigin Command Prompt and look at the Default Gateway - On Mac: Run
netstat -nr | grep defaultin Terminal
Log in with your admin credentials. The default username/password is often printed on a sticker on the router itself. (If you haven’t changed these, please do — it’s a basic but important security step.
Step 2: Find the Traffic or Statistics Section
Navigate to a section typically labeled Traffic Monitor, Bandwidth Monitor, Usage Statistics, or Network Map. Here’s a quick brand-by-brand cheat sheet:
| Router Brand | Where to Find Bandwidth Stats | Built-in Monthly Reports? |
|---|---|---|
| ASUS | Traffic Analyzer → Traffic Monitor | ✅ Yes — daily, monthly, yearly |
| Netgear | Advanced → Traffic Meter | ✅ Yes — with alerts |
| TP-Link | Advanced → Statistics | ⚠️ Partial — real-time only |
| Linksys | Connectivity → Local Network | ❌ Limited |
| Google Nest WiFi | Google Home App → Devices | ⚠️ Via app only |
| Eero | Eero App → Network Details | ❌ No (use third-party) |
Advanced: DD-WRT / OpenWRT Firmware
If you’ve flashed your router with DD-WRT or OpenWRT firmware, you get access to granular real-time bandwidth monitoring tools unavailable in stock firmware. Tools like nlbwmon and bmon can log per-device usage to internal storage or a USB drive — giving you historical data spanning months.
⚠️ Watch Out: Most consumer routers don’t store historical data permanently — they reset on reboot. If yours lacks built-in monthly reports, consider a dedicated bandwidth monitoring tool or a NAS-based solution for long-term tracking.
5. How to Check Data Usage on Android & iPhone
Mobile data caps are real and painful. Both Android and iOS have solid data usage tracking built right in — you just have to know where to look.
Check Data Usage on iPhone (iOS)
Step 1: Go to Settings → Cellular. Scroll down to see a per-app cellular data breakdown. Toggle apps off to prevent them from using mobile data at all.
Step 2: Scroll to the very bottom and tap Reset Statistics on your billing cycle reset date. iOS doesn’t do this automatically — if you forget, your numbers become meaningless.
Step 3: While you’re there, scroll down and check Wi-Fi Assist usage. This feature silently switches to cellular when your WiFi is weak. It can deliver nasty surprise charges at the end of the month.
Check Data Usage on Android
Go to Settings → Network & Internet → Data Usage (the exact path varies slightly by manufacturer and Android version).
You’ll see:
- A graph of your data usage over the current billing cycle
- A per-app data breakdown sorted by consumption
- The ability to set data warnings and hard cutoff limits
- A Data Saver toggle to restrict background data for non-essential apps
Samsung One UI users also get a Daily Data Usage widget that makes monitoring your consumption effortless without opening settings every time.
6. Best Third-Party Tools to Monitor Network Bandwidth
Built-in tools are great for quick checks. But if you want deep visibility — historical data, per-device graphs, protocol breakdowns, and smart alerts — third-party bandwidth monitoring tools are the next level up.
| Tool | Best For | Platform | Pricing |
|---|---|---|---|
| GlassWire | Visual per-app usage + alerts | Windows, Android | Free + Paid |
| NetBalancer | Per-process bandwidth control & throttling | Windows | Paid |
| Little Snitch | App-by-app network filtering | macOS | Paid |
| Wireshark | Deep packet inspection & forensics | Win / Mac / Linux | Free |
| PRTG Network Monitor | Enterprise-level bandwidth reporting | Windows (agent) | Free + Paid |
| NetWorx | Daily/monthly usage logs & alerts | Windows, macOS | Free + Paid |
| My Data Manager | Mobile data tracking & billing alerts | iOS, Android | Free |
GlassWire — The Most Visual Option for Windows Users
If you want one tool that makes monitoring internet bandwidth usage almost addictively satisfying, GlassWire is it.
Its timeline-based graph shows exactly which app was using bandwidth at which specific moment in the past. It also fires alerts when a new app tries to access the internet for the first time — incredibly handy for catching malware phoning home. The free tier covers most home use cases perfectly well.
Wireshark — The Professional’s Swiss Army Knife
Wireshark is the gold standard for network traffic analysis. It captures every packet flowing through your network adapter, letting you filter by protocol, IP address, port, or application layer.
It’s overkill for casual usage tracking, but indispensable if you suspect a specific app is misbehaving, you’re troubleshooting a corporate network, or you want to understand exactly what data is leaving your machine and where it’s going.
Don’t Forget Your ISP’s Own Portal
Overlooked but often the most authoritative option: your Internet Service Provider’s account portal. Most major ISPs — Comcast Xfinity, AT&T, Verizon, Spectrum — have dashboards or apps showing your monthly data usage history, broken down by day.
This is the number that actually matters for your bill, because it’s exactly what your ISP is counting toward your cap.
💡 Best Practice: Set up usage alerts — not just hard limits. Getting a warning at 80% of your monthly cap gives you time to adjust habits rather than getting blindsided by an overage fee or a throttled connection.
7. FAQs About Bandwidth Monitoring
How do I check bandwidth usage on my home network for all devices?
The most effective method is through your router’s admin panel. Log in at your gateway IP (usually 192.168.1.1), navigate to the Traffic Monitor or Statistics section, and you’ll see all connected devices and their data consumption. For more granular reporting, ASUS routers with their built-in Traffic Analyzer are particularly strong. Alternatively, tools like PRTG or GlassWire can monitor your entire network from a single PC.
What’s eating my bandwidth without me knowing?
The most common silent bandwidth consumers are: automatic cloud backups (iCloud, Google Drive, OneDrive, Dropbox), Windows Update downloading large patches overnight, streaming apps pre-caching content, peer-to-peer or torrent software running in the background, smart home devices, and — if your WiFi password is weak — unauthorized users on your network. Use Task Manager on Windows or Activity Monitor on Mac to identify the culprit in real time.
How much bandwidth does streaming actually use?
It depends heavily on quality:
- Standard Definition (480p): ~1 GB/hour
- HD (1080p): ~3 GB/hour
- 4K Ultra HD: ~7–25 GB/hour (varies by platform and compression)
Multiply by the number of people streaming simultaneously in your household to estimate your true total consumption.
Can I check bandwidth usage without installing any software?
Absolutely. On Windows, use Settings → Network & Internet → Data Usage, or Task Manager’s Resource Monitor. On Mac, use Activity Monitor’s Network tab. On mobile, check Settings → Cellular (iOS) or Settings → Data Usage (Android). For full network visibility, your router’s admin panel requires zero additional software.
How do I reduce my bandwidth usage once I find the problem?
Start by identifying your top consumers (using the methods above), then:
- Lower streaming quality settings in Netflix, YouTube, and Spotify
- Schedule large downloads, updates, and cloud backups for overnight off-peak hours
- Limit background app refresh on all mobile devices
- Enable Data Saver mode in Chrome and YouTube
- Make sure your WiFi is properly secured so no one’s freeloading on your connection
- Disable automatic update downloads on gaming consoles (PlayStation and Xbox are notorious data consumers)
Wrapping Up: Take Control of Your Internet
Knowing how to check bandwidth usage is one of those skills that seems minor right up until it saves you from a $50 overage charge, a maddening slow connection, or a security breach you never saw coming.
The tools are all there — whether you prefer the simplicity of your router’s built-in dashboard, the real-time clarity of Task Manager, or the deep forensics of Wireshark. You don’t need to become a network engineer to get meaningful insights. Start with one method, pick whichever platform you use most, and check in at least once a week.
You’ll quickly develop an intuition for what’s normal on your network — which means you’ll spot problems the moment they appear, not after they’ve already ruined your evening.
The bottom line: your internet connection is a resource, just like electricity or water. The people who monitor it are the ones who get the most from it — and pay the least for it.